W.D. Gann's Law of Vibration
An explanation of: The Law of Vibration as applied to the financial markets by the trader W.D. Gann.
You will find thousands of explanations and theories about what this famous trader did and what is the law of vibration and how he applied it. For probably millions of traders and researchers found anywhere, this pursuit and challenge commands them to study this man's work for a lifetime. Many give up, and many follow through into every avenue of research that the human mind can conjure up. What you read on this site is put up here for the students and researchers who want to take this information and use it and take the work into realms and areas along the same lines of thought. My interest in the markets is now over, and I no longer pursue this endeavor, but it is a fascinating subject of study and for those who have the burning desire to continue the research, enjoy this sites content, and prove to yourself by validating what it is written in W.D. Gann's own books and courses.
The ticker interview W.D. Gann did is often quoted as the most accurate description of what the law of vibration is. This article has a lot of cryptic language and veiled meaning as to what exactly he is talking about. However, the charts found in W.D. Gann's courses and the story from his novel The Tunnel Through the Air contain a majority of the major clues as to what he was doing. One thing that W.D. Gann did almost exclusively over and over again is to show "examples" of him doing some form of geometry or technical analysis, but he would do this with an intentional misleading or sleight of hand concept. The major examples of this, which immediately takes all students of this trader's writings down the wrong path is what is called the Gann Square. You find many of these plastic overlay squares that he taught were designed to be placed over hand drawn charts. These he claimed would have some form of prediction or show precisely where major support or resistance would be found in time and in price.
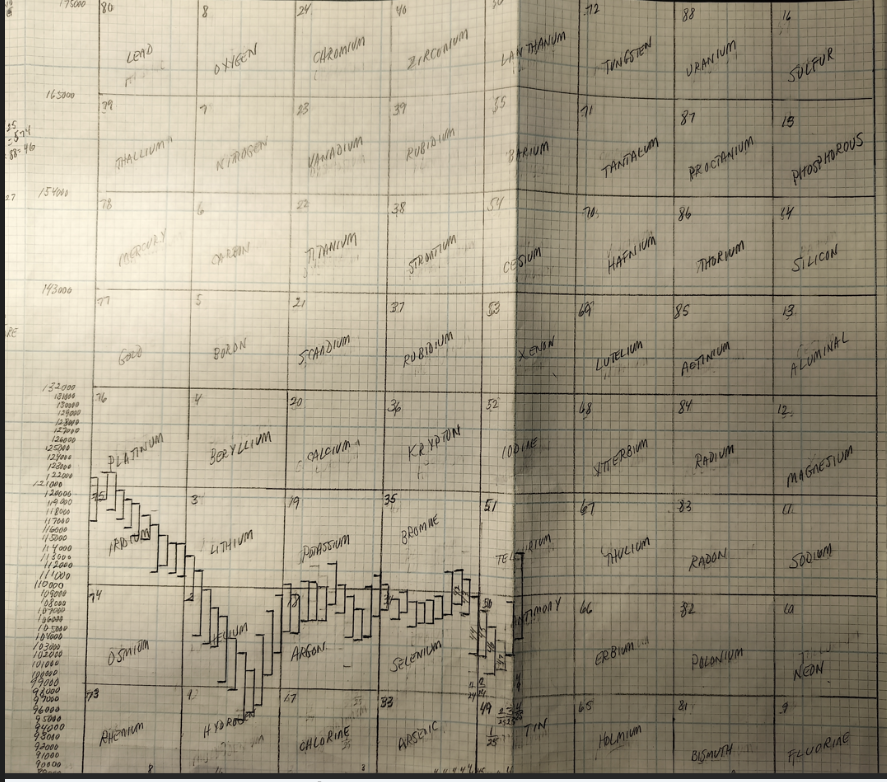
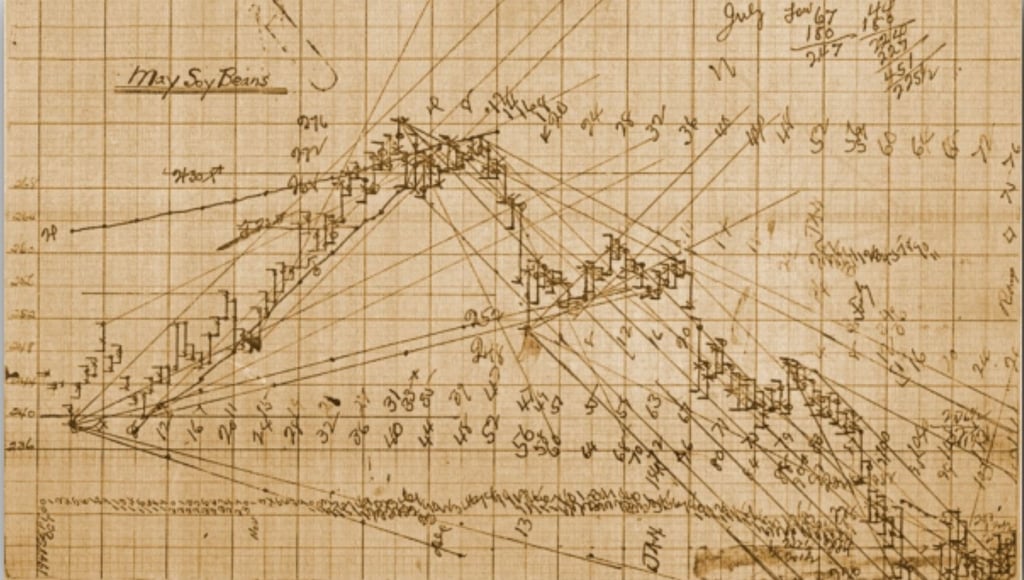
Even though he sold these squares, and taught how to use them, this is not what he did, nor is it the law of vibration. W.D. Gann taught this "concept" as an allegorical, metaphor or as an analogy to teach what he did not want to show outright. These so-called Gann squares are really the periodic table of the chemical elements, he left this legacy of geometric angles, squares and such as a level of teaching that did not actually show or display what the entire concept is really about. This was done for a number of reasons, although not important for this discussion. One other concept that is very famous from the charts of W.D. Gann is this idea of him running time counts from tops or bottoms in the grain markets specifically, he taught this and also the idea that a price at a top or bottom is going to spin out time cycles, or time periods where a change in trend would occur. An example would be if the May Soybeans made a high of $9.08 cents, then the market under question would make trend changes every nine days, weeks or months. This idea is patently absurd and can be easily proven to be false.
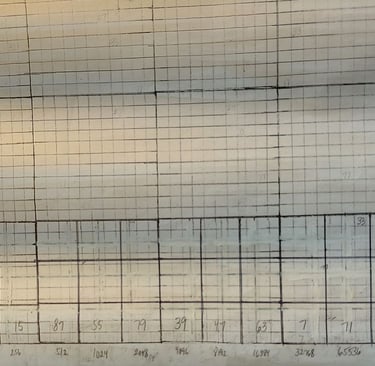
So right there you have three very important foundational concepts from the basic understanding of what was seen in the books and courses from W.D. Gann. Below I have put up a famous chart that illustrates the time count idea from W.D. Gann.
Now on that chart above, you can see the time counts from both swings as if there was something very important to know about at some specific time in the future. But also, this chart is very famous as it shows a conjunction of Jupiter and Saturn at a zodiac degree that matches the price of the bean market. Interesting for sure, but that is not what W.D. Gann used or did with the markets. Did he dabble in astrology, the zodiac and the planets as applied to the financial markets? Yes, he did, but that is not the law of vibration as he taught or used it. Knowing that chemistry and the periodic table, hence the substance of creation, and matter, would easily make him look to the sky and the celestial mechanics as another component that could or would show associations that could be beneficial. Especially once he knew that the 88 naturally occurring elements is married to the 88 known constellations.
This idea of counting time counts off a high or low is a veiled teaching concept of how any space area of any chart can be mapped to a chemistry element, and that particular elements is throwing off vibrational characteristics. Now there are many things happening with this concept including counting the remainder of the elements to show where the periodic function is completed at. The primary thing that W.D. Gann figured out is that the mass of the element is the actual price that is displayed on the vertical axis of any chart, once you have mapped the chemistry panel to the chart. The other thing he noticed but to a lesser extent is that the melting and boiling points are also in control of the market top and bottoms.
Another concept that was taught with a veiled meaning is the idea of angles from zero. This geometric technique was done in the courses and applied to the grain markets. At a major top or bottom an angle from zero, was drawn out into space and time and when the price intersected this angle in the future you would expect a major change in trend. Again, this is not applicable, but what he was teaching is the way to use the elements and position them properly on the chart. The teaching about all-time highs and lows including the gravity centers is also another veiled teaching concept about the elements. In the master charts section of the Gann course, you will see quite a bit of written information about the natural squares of numbers and the center of the same. It was said that these numbers are important for price and time resistance, again this is not what he was teaching, but the law of octaves he is describing is applicable to the chemistry panel as superimposed to any financial market.
In the master charts section of the commodity course, you will see the master 12 chart, the square of nine, six squares of nine, the hexagon chart, the master chart of 360, the spiral chart, The New York Stock Exchange Permanent Chart, and other writings on the various geometry he taught. Now W.D. Gann wrote, we know of 3 dimensions, height, width, and length, but there is a four dimension of element in market movements along with the square and the triangle from within the circle but there is an inner circle and an inner square, as well as an outer square and an outer circle which prove the fourth dimension in working out market movements. None of these charts have anything to do with the law of vibration and how it was applied or thought about.
In various books you can read where W.D. Gann talked about nuclear power, the elements, and Hydrogen and how markets would melt and boil at tops and bottoms. All these sentences are veiled subtle teaching of what the law of vibration is. The Tunnel Through The Air novel is the primary source of what this geometry he taught is all about. There is far more to all this subject, but this is the concept W.D. Gann was teaching within his veiled and coded language in his books and courses. For example, in the Tunnel novel, he talks of spirits on the lake, walking on the water. These are elements reacting and dancing on the water, he speaks of the Radium Ray and the Demon of Death melting skyscrapers and of Boiling Springs. It should be quite obvious what he was teaching. The entire story is littered with the chemical elements, and chemistry. He also talked a lot about cycles, repetition, astrology and the importance of somethings beginning, i.e. the natal date. Now the idea that you can know or use something you cannot see or track, such as a cycle is absurd and he did not do that.
One of the most important things in the book is on pages 75 through 77, the concept of something repeating and of like produces like. That pretty much sums up the entire basis of his market geometry theory. Knowing what something is vibrating to and having a map to know when the price is back on that initial vibration, because when that is mapped and known you know the behavior of the price well in advance and in real time. Now eventually a student who spends a lot of time studying and applying this geometry, you begin to realize that you are looking at "machine language", you are looking at computer code displayed on a geometric chart. I can refer you to James Gates computer code theory.
These charts are nothing but computer code, machine language, compiler code. All markets are the same, there is no such thing as an economic cycle, time periods. These squares are deterministic and permanent points of force, that are already in effect far in advance of the temperature, i.e. price being present in it. In the Tunnel novel, W.D. Gann says, "It is not my aim to explain the cause of cycles, as the public is not yet ready for it" Translated, you are living in an artificial construct, a computer simulation. There are no time cycles, just the repetition of the elements in the chemical squares. A long study of the diagrams and writings of Walter Russell gives a very thorough breakdown of the cinematic light wave octave and how the elements are carried on it to create the simulation.
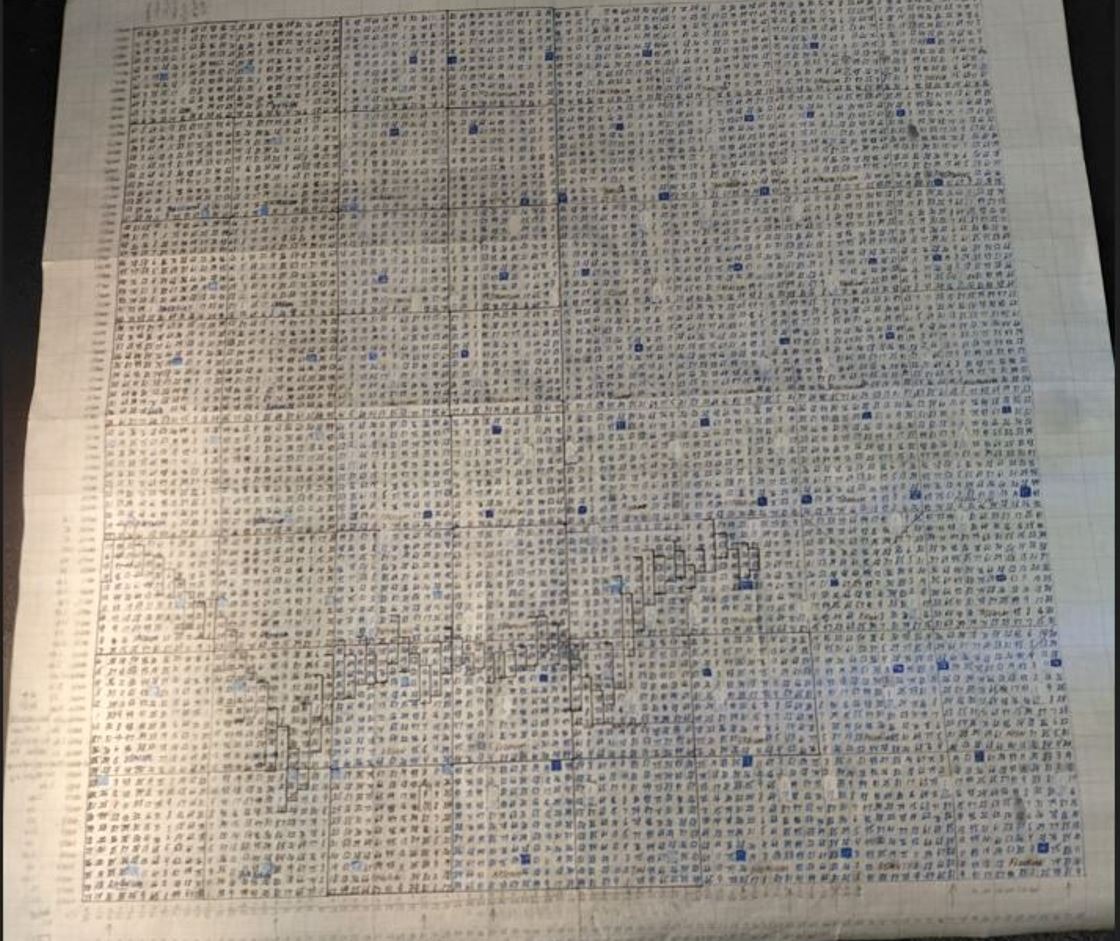
So all these ideas and concepts are a veiled teaching on how to setup these charts, and learn to use them by bridging these modalities onto the theory that the markets are controlled by the chemical elements and their relation to each other by attraction and repulsion. In order to set these charts up correctly, you must know the all time high, because to configure the elements and position them properly with the correct amount of gain. And to be able to set them in time from the natal you must know this information about the markets past and inception data. The primary verification to know if the square is setup properly is to always find the elements Uranium and Hydrogen on the bottom and top of any square, they must be there if the chart is configured properly based on the past performance of the price action. The chart below is a monthly Eurodollar chart, and it shows a major top on June 2021 and it sold all the way down until September 2022. If you look at that chemical template, which is a seminal version and not the way you would use it, although it does show the price going straight to the element Hydrogen, which is the periodic function, as the market will rise on Helium. What you see below is an outer template, but like W.D. Gann says there is an inner square, in fact there are many dimensions down to a more refined lower more detailed picture of the elements. You are doing the same exact thing as a scientist who looks at something with their eye then looks at the same thing with various power levels of an electron microscope.
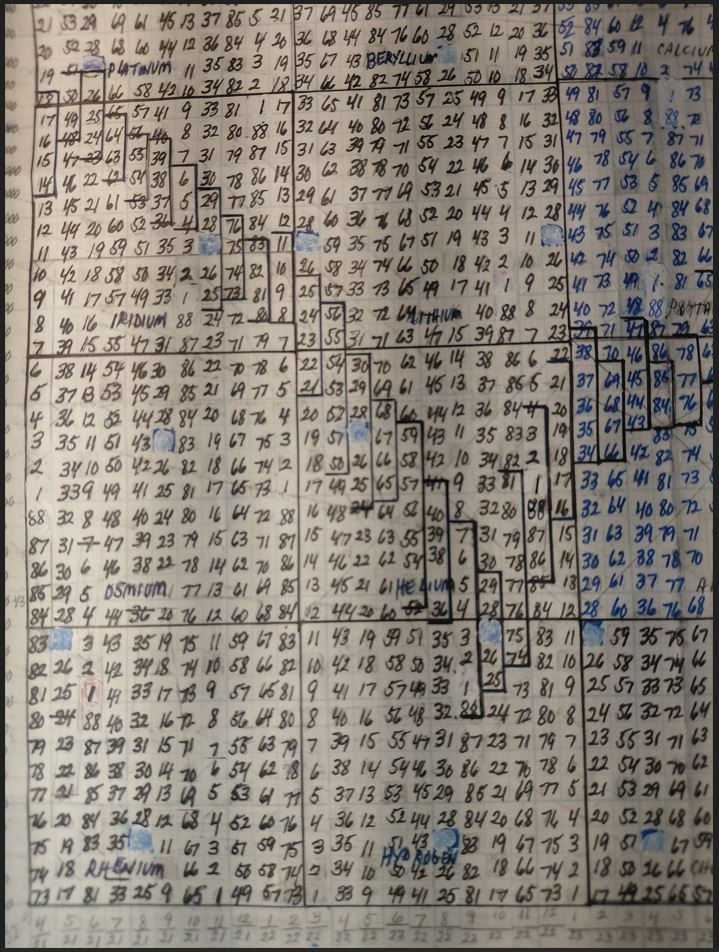
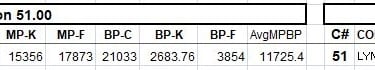
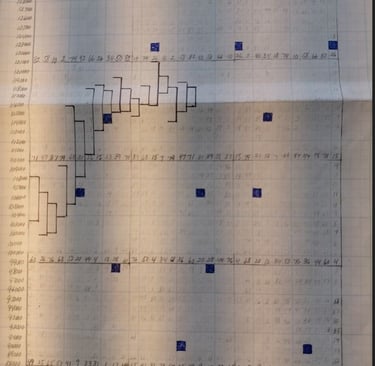
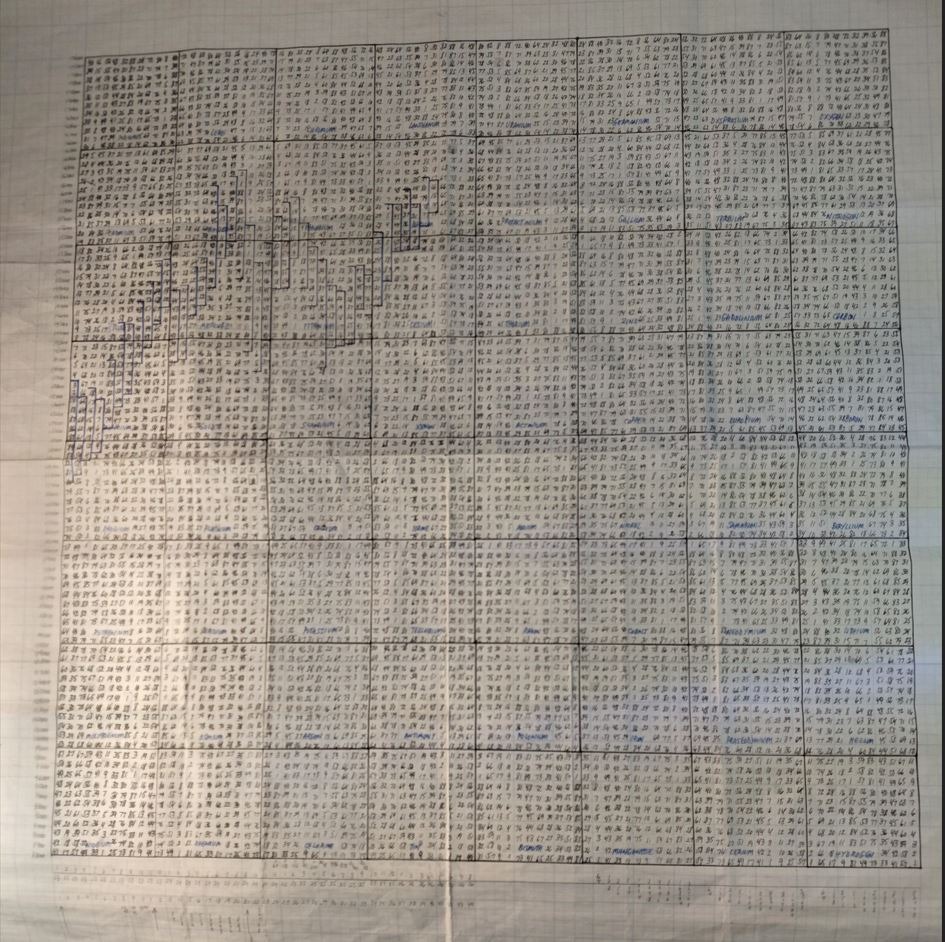
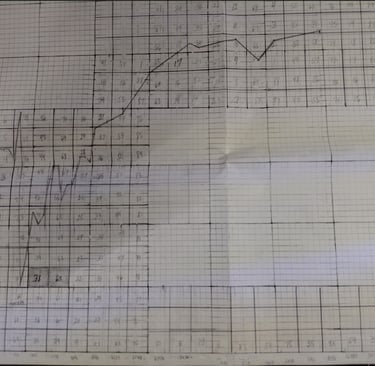
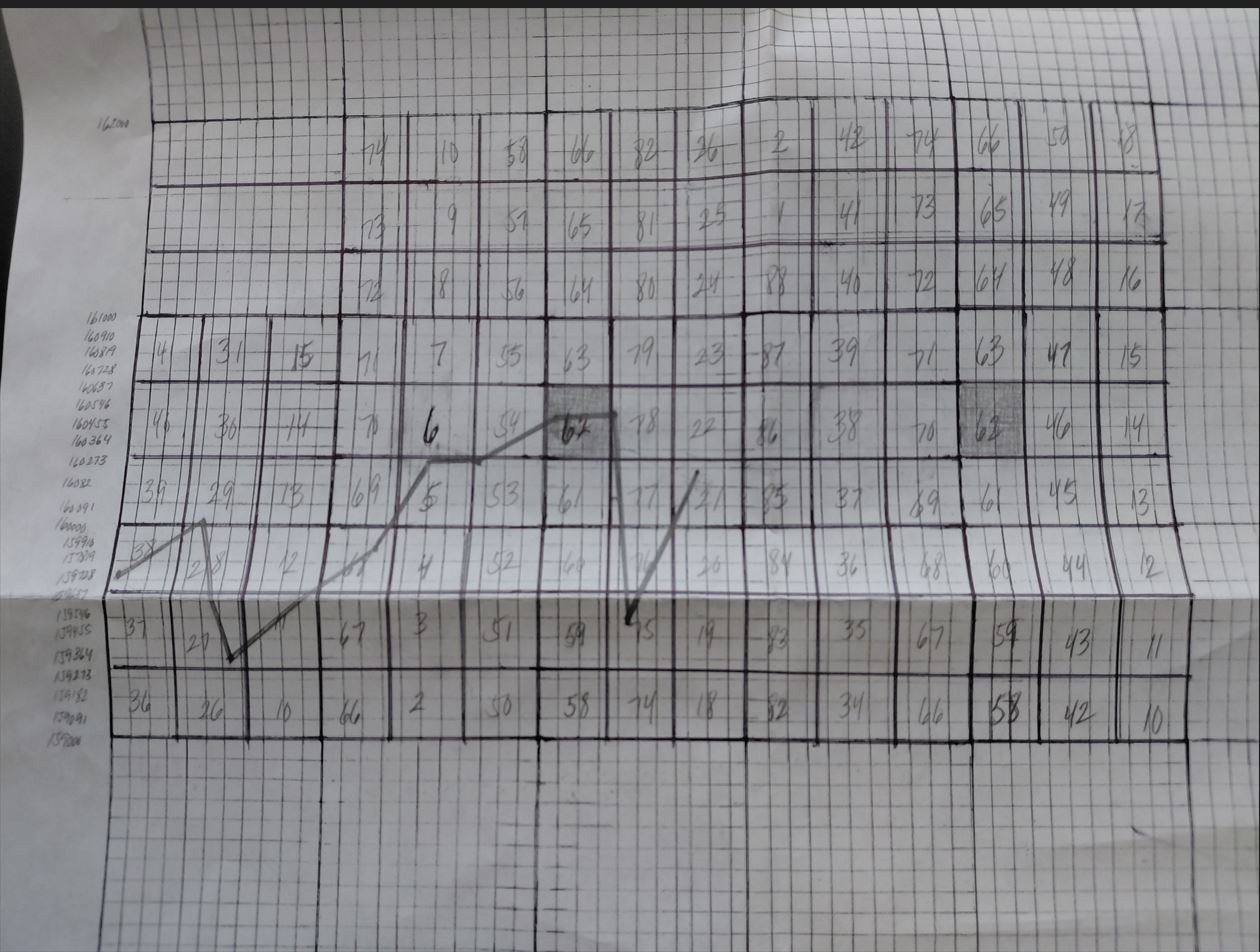
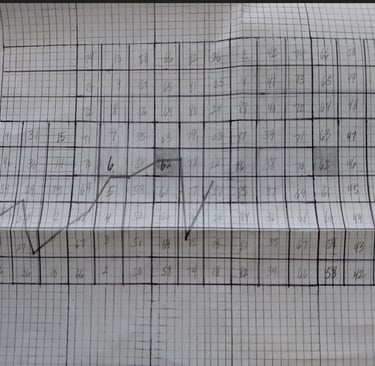
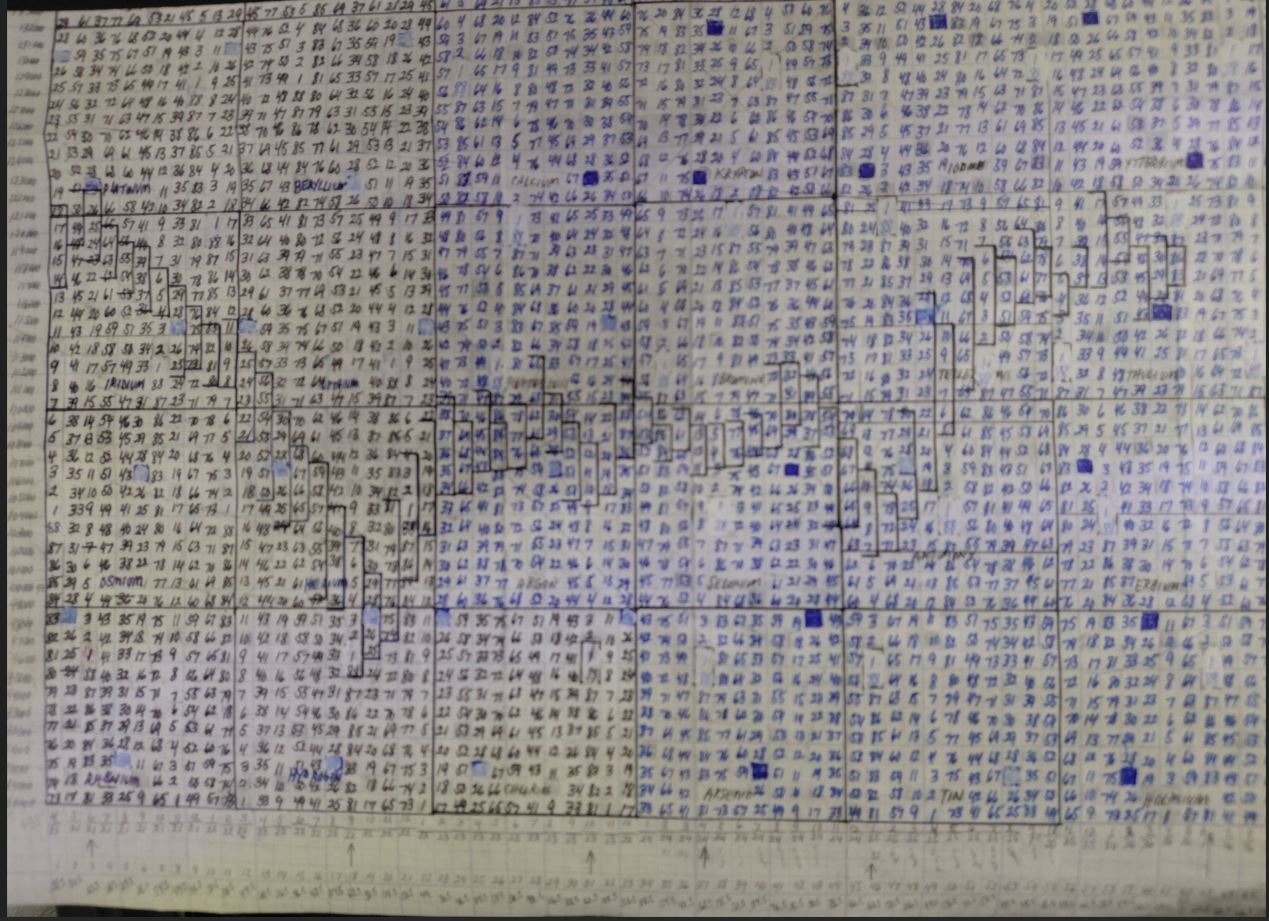
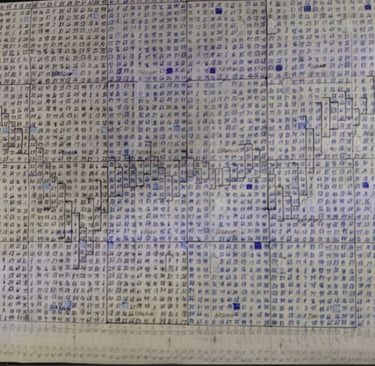
Now the chart above is the first dimension, this is not the chart that trades are found on, but it is the foundation for the subsequent geometric charts and chemistry panels. The second dimension can be found by using the law of octaves and then the vertical columns get their own elements. However, when you become skilled and have made hundreds of these kinds of charts, you realize that you do not have to do all this work, you can just take the structure that is needed, i.e. the foundation on the lower part of the square and just reconfigure the next dimension. If you start to look at these charts on the vertical column, you see these are the skyscrapers often mentioned in the Tunnel Through the Air novel. These dimensions are found by the understanding of how much gain each element is gaining from the prior element, and this is directly related to the distance of the all-time high of any market. If you look to the lower left of the above chart, you see the element Rhenium, the seventy third element, and the one to the right of it is Hydrogen, and the one to the right of that is Chlorine, number seventeen. Each one eighth cell is based on a gain of plus sixteen elements, as 73 plus 16 minus 88 is Hydrogen, and 1 plus 16 is Chlorine and so on all the way over to the right of the chart. The next step would be to put the elements in each cell for the entire chart, this is a good idea to do a few times to get a feel for what you are working with and looking at, but ultimately it is not required, as dimension one, two, three are not where the trades are found. Dimension three does show directional bias by the observation of where the receptor element is located in price and time. The fourth dimension is where the trades are located by setting up charts and configuring them based on the outer structure of the square where you can locate the points in time and price where the element that likes produces like are found. I will show some examples of this and what kind of geometry is determining the tops and bottoms. Now take a look at the monthly Eurodollar chart below, this is showing both the first and second dimensions, as you can see each individual cell if filled in with an element, starting at the bottom of the chart and continuing all the way to the top of the square, repeating after the 88th element is reached. This is machine language, computer code if you will. Using a square of 88-time units and 88 thousand price units, each one eighth square contains 121 cells as 88 times .125 is 11 units up and down.
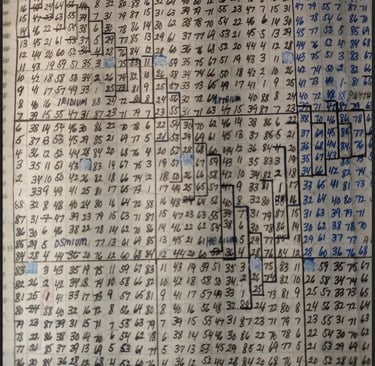
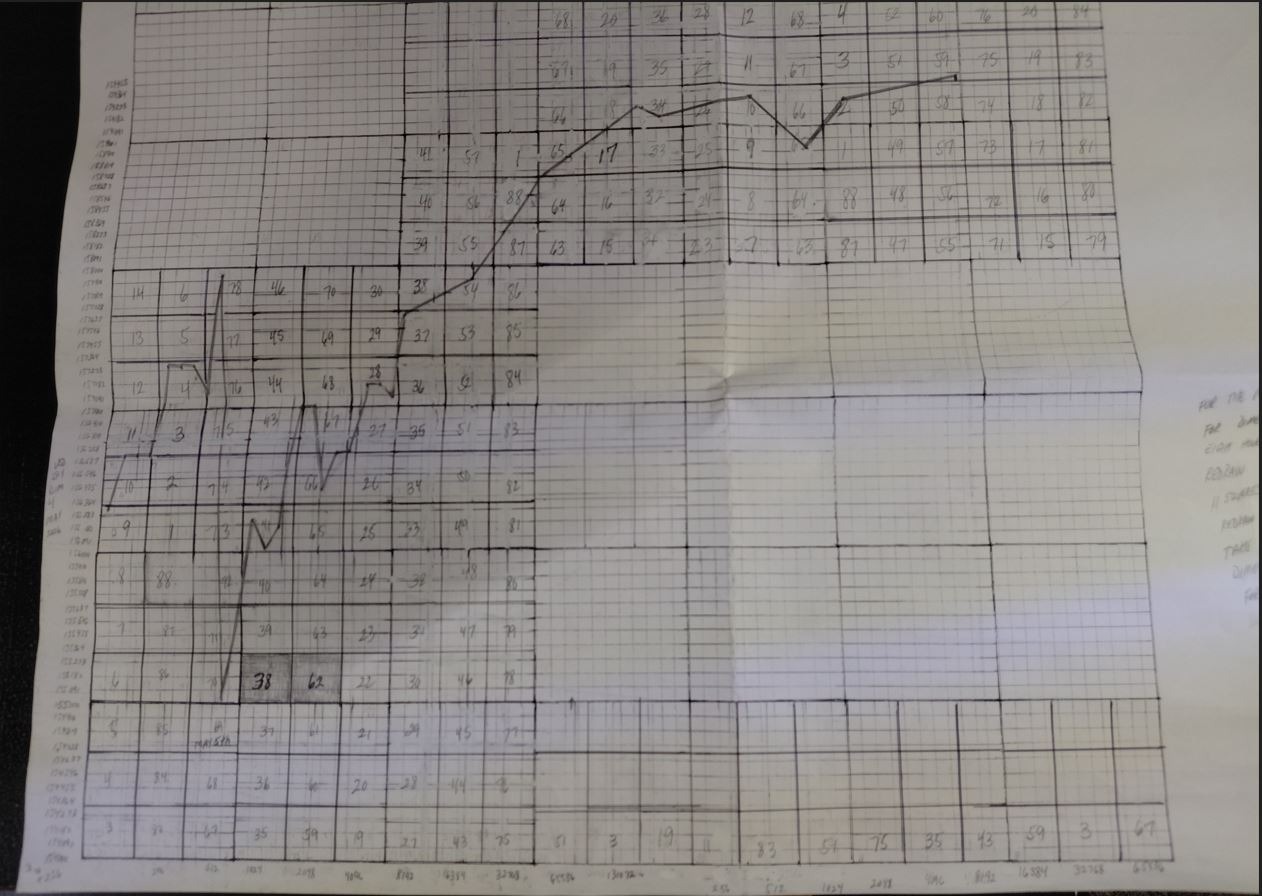
This chart above has the second dimension filled in, but like I said, this is no longer necessary once you understand what is actually needed to find the trades based on the fourth dimensional chart. Just for the sake of illustration, I am showing this and how it looks and how it is configured. The chart below is the exact same chart, just a closer look at the price bars and elements from the first two columns from the left. The top to the left came in on June 2021 at a price level of 122535, it made a double top between May and June, the actual high was in June, then sold off to September 2022 at a price level of 95353. If you look closely at the third vertical column, you can see the price made top in the second dimension on element number 27, Cobalt. There are ways to validate or vet the geometry, and here is one way. W.D. Gann talked a lot about the natal date of a market and how it had inherent characteristics to what something is and how it will it behave at least in reference to the law of vibration. The first trade for the Eurodollar is June 1, 1979, now taking to the subject of numerology, that number string: 611979 / 88 elements give six thousand nine hundred and fifty-four completed squares and the fraction of point three zero six eight times eighty-eight is Cobalt, element 27. On the second vertical column, the element at the top is 51, and the third column is element 27. If you subtract 27000 price units from the top of 122535, you get 95535, the exact low in September 2022. The mass from element 51 in dimension 51 is 27115, and if you subtract 27115 from the top at 122535, you get the low in September 2022, also the melting point for Tellurium in Celsius is 95519, again the low price. This proves that the geometry is correct, the elements are configured properly and set in the square so the chemistry panel is going to display the light wave octave in its accurate reflection. W.D. wrote volumes on the idea of things repeating, and that all market movements are repetition of the past, with that being said, there is only one way to know and see if something is repeating, and that is you must have something to observe to know and see if there is something that is actually repeating. Find the element 27 at the top to the left in the third column, now scan that same horizontal column to the right until you see element 27 repeat again, and then follow that vertical column down and you will see it is September 2022, where the market made low at 95353. In fact, every time the number 27 shows up again you will see trend change, and this is precisely why W.D. Gann showed those grain chart with the time counts off highs and lows.
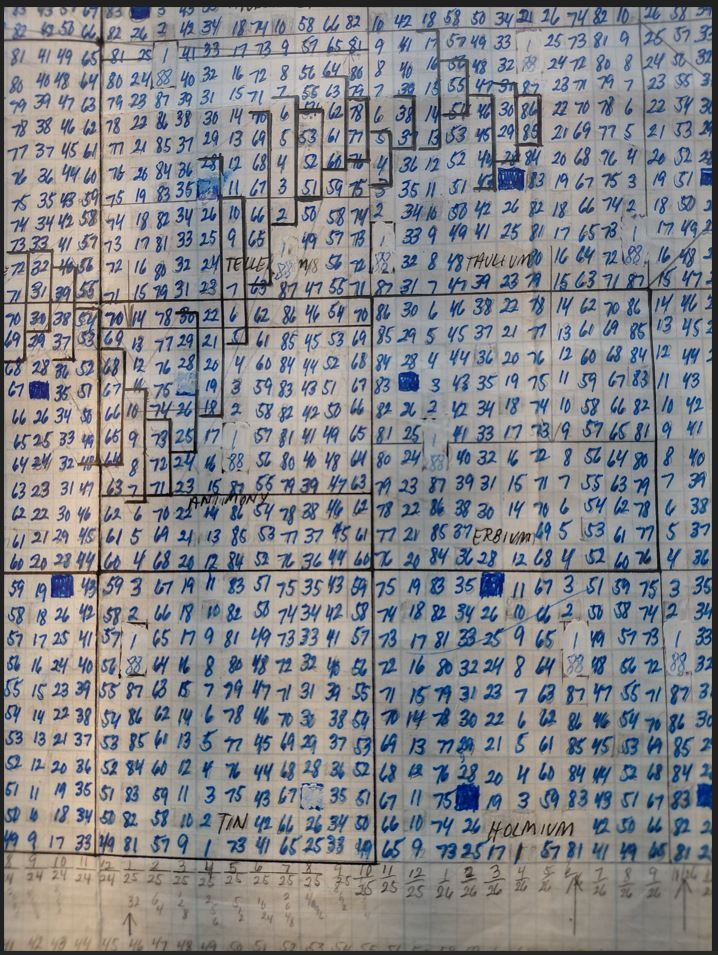
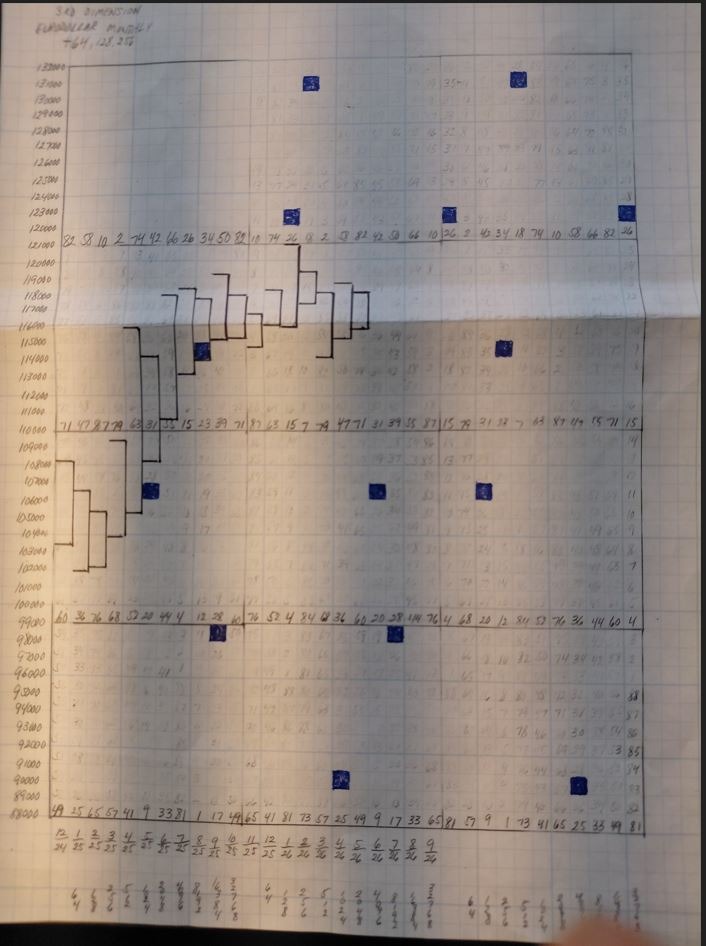
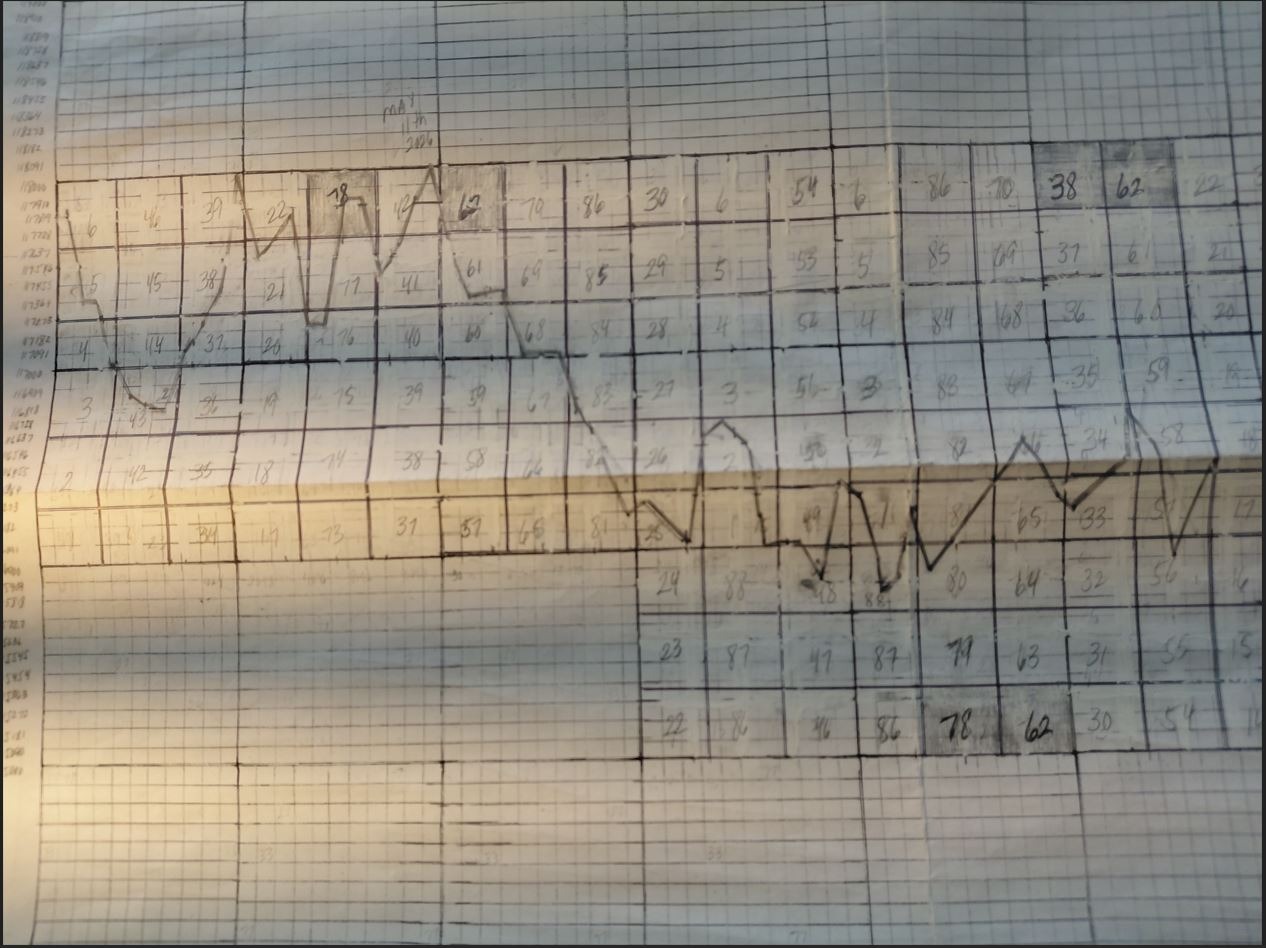
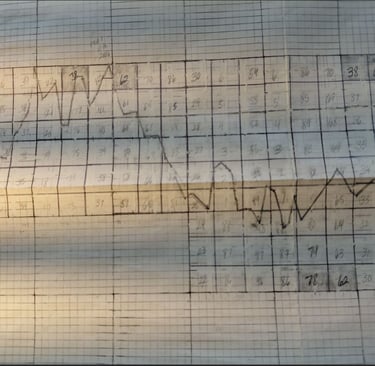
In the first dimension, the elements gain plus 16 for each one division, however if you look to the number 73 in the first column on the lower left above, you see the elements moving to the right are 17, 81, 33, 25, 9, 65, 1, 49, 57 and then in the eleventh column in that one eight division, the element 73 Rhenium repeats again. That is what W.D. Gann meant when he said, all things repeat, that is harmonic analysis, that is machine language, machine code, compiler code if you will. That is dimension two, and all that is needed is the first horizontal column all the way across the square, it is not necessary to fill out the entire square once you understand what you are doing. The algorithm is an octave higher than what it was in dimension one. An example being, the octave of 16, which is what dimension one is designed on is the number 32. And 73 plus 32 minus 88 is 17, and 17 plus 64 is 81, and 81 plus 128 / 88 is 33 and 33 plus 256 / 88 is 25, and 25 plus 512 / 88 is 9, and 9 plus 1024 / 88 is 65, and 65 plus 2048 / 88 is Hydrogen, and 1 plus 4096 / 88 is 49, and 49 plus 8192 / 88 is 57 and 57 plus 16384 / 88 minus 186 x 88 = 73. And that is how the machine language repeats, the first and eleventh columns repeat due to the octave series over the prior dimensions gain. Once again, in dimension ONE, the gain is plus 16 for each vertical column, but in dimension two you are now looking into the electron microscope further into the square. In dimension one there is one element for each one eight division, but in dimension two there is now 121 units. In the second chart below, I am showing a segment of the third dimension for the Eurodollar. It starts on December 2024, where the element in first cell on the bottom of the chart is number 49, these are the same as W.D. Gann's angle from zero, because the machine language for the chemistry panel must come from the bottom of the square. The only elements you need are the ones on the first horizontal line of each one eighth division, because that gives you 11 thousand units of vertical price structure, of course the market can and does breach these one eight divisions on occasion, for any particular month, but it is not the norm. On this chart below, I have marked the element 27, Cobalt which controls the Eurodollar, and you can see they identified the trend fourteen months in advance, and the market went up to January 2026, where it made top on element number 27. Now this is how you get to the third dimension of the inner square, by creating the first level and showing the element configuration, then get the bottom horizontal element strings. i.e. the angle from zero using the octave of the gain used in dimension one. Then for dimension three, you take the element on the bottom of the square and recreate the next dimension based on the octave of the one used in dimension two. An example being for the Eurodollar, dimension one has a gain of plus 16, dimension two has a gain of plus 32, and dimension three will use a gain of plus 64. This will recreate the repetition of the elements within the one eighth division in vertical columns one and eleven, but now you are getting a glimpse of what the inner structure of the original square is, no different than a scientist looking at the fabric of matter with an electron microscope. One thing that W.D. Gann never spoke about in any of his writings, books, or courses is the Golden Mean, the Golden Spiral or more specifically, the Fibonacci number series. Now to think that he did not know of these numbers or history is beyond absurd, he knew everything else along this line of inquiry, and he most certainly knew about the Golden Mean and the associated numbers that control it, but yet he never mentioned or talked about it. I find this strange and I think he did this with the utmost intent, because these numbers control financial market growth cycles and decay, and they are profoundly powerful in the chemistry table. If the reader is familiar with very famous Mandelbrot set videos, you know that the fractal imagery as it looks further and further into the set is based on the Fibonacci sequence or iteration and reiteration of the same. When you get the geometry into the fourth dimension, with a little adjustment of the spacing of the elements you now see the tops and bottoms automatically coming in on the most common Fibonacci numbers, but now they are on the periodic table within the chemistry panel of the geometric square. This chart below is the same dimension one and two for the Eurodollar monthly, but it shows the time period from December 2024, if you look at that major low in January 2025, it came in on element Carbon, number 6 and there is the Fibonacci number 6.18. If you look up that vertical column all the way to the top of the chart, you will see the element Cobalt, number 27, and that is 43 months from that top it made earlier in June 2021 where it made top on element number 27. This is why W.D. Gann was teaching those time counts from the tops and bottoms on the grain charts. Like I mentioned above, every time that element number 27 shows up on that same horizontal line, there will be a change in trend. This is what W.D. Gann called like producing like in the Tunnel Through the Air novel.
I will show how the third-dimension chart is designed below, take notice of the element number 49 above the date of December 2024. That is the first element in that horizontal row and then repeats in the 11th position. Now to create the fourth dimension, it is required to use the octave of the original charts gain per vertical column. For the fourth dimension, the gain for each vertical column is going to be plus 64, so the second column for that one eighth division will be 49 plus 64 - 88 for element 25, then 25 plus 128 / 88, then 65 plus 256 / 88 minus 3 x 88 for element number 57. This continues all the way to the right until the element 49 repeats in the 11th position. On the third-dimension chart below, notice how the price was forecasted fourteen months in advance, it tracked the blue squares which are Cobalt, which is what this market vibrates to from the natal date.

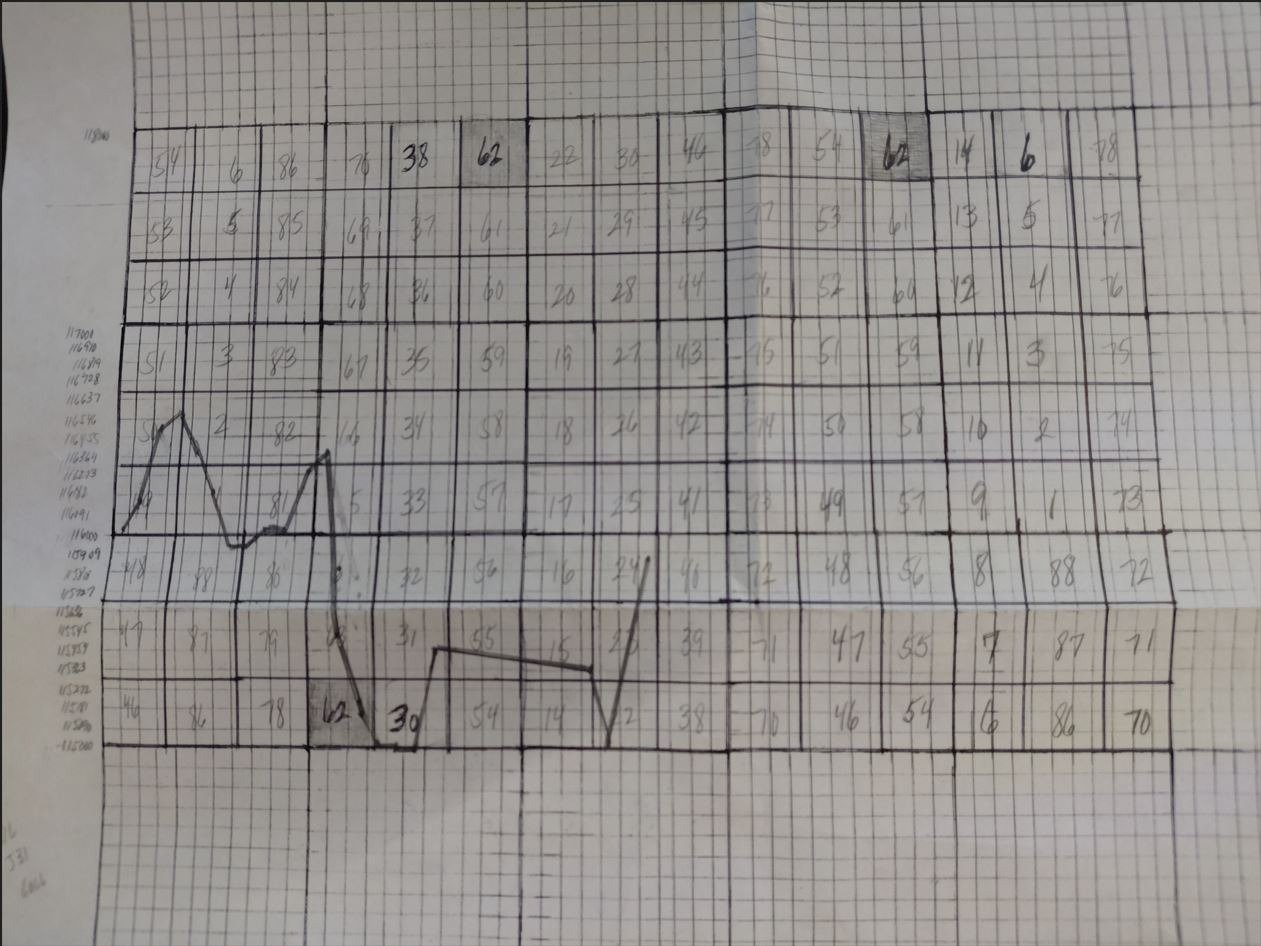
From here I will show some examples of the fourth dimension, and how the price naturally seeks these points with one hundred percent regularity. Creating the four-dimensional square with the chemical elements is simply locating where the price is actually trading at going into any month. Once this is known, the element that is in that particular vertical column for that particular month is the starting element, and then for 11 slots that will remain in force, until it repeats, at that point the next element to the right from dimension three is used. Since I am tracking eight-hour bars, we get on average about 66 to 71 bars per month. So, the square would be vertically ONE, one eighth division of 11 time slots and 11 thousand points of price for any particular month. It will not be necessary to create the entire grid, but only what is needed for the price action during the month. Once the chart is at the fourth dimension, it is no longer necessary to keep tracking this frequent and high-powered viewpoint of the inner square. And the reason why is you do not want the elements to repeat as often or frequently. What you want is to track less area per one eighth division. So what is done is to only look at nine units per one eighth division, versus the prior 121. An analogy would be to use a map on the internet and zoom in to a very specific area with much minutia and detail, but once you have that view, you zoom out again on the detail you just saw. Same thing here, get the fourth dimension of the inner square, then zoom out to space the elements in a much more effective fashion, making the periodic function or point of repetition, much less frequent, thereby getting the tops and bottoms with great accuracy. The chart below is the fourth dimension for the Eurodollar for May 2026. You can see the market made top on May 11th, at 117871 price level. Notice the element, 62, Gadolinium, the Fibonacci number, as 61.8 is the golden mean. Do not overlook the fact that each one eighth division is a "square of nine"
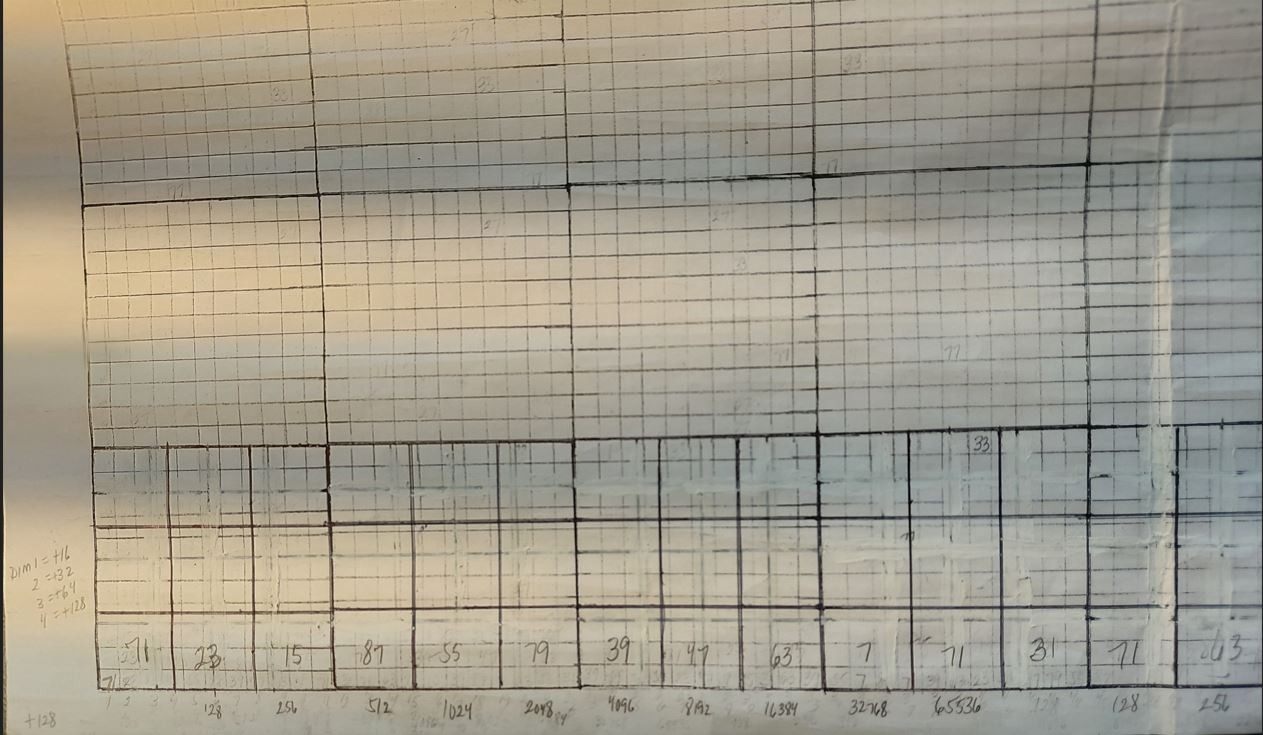
Below here is what the bottom of the square for the fourth dimension looks like, every 11th position repeats, and then in slot 12, the next element from dimension three is utilized. On the fourth dimension the gain is now plus 128, 256, 512, 1024, 2048 and on to completion. That is machine language, natures compiler code of the light wave octave which all material matter is situated on. You can see how element 71 starts the series and repeats at the 11th position where element 31 starts a new string based on the exact same algorithm.
The chart below is for the Forex currency pair USD JPY, it shows dimension one and two, but like it was said before, you do not need to complete this grid, only the "angle from zero" or the bottom of the square, it is from this that the third dimension is created and from that the fourth dimensional chart. When you become skilled at making these charts and understand exactly what is going on, you quickly realize that there are shortcuts to get access to the fourth dimension, where you can locate the winning trades. It should be said that each dimension offers different worthwhile geometry and concepts that can be utilized but the fourth dimension is really where the best geometry will be displayed, especially the Fibonacci component. On this chart, the one eight divisions in dimension one, are plus 32, because of the all the time high in the past. This is what determines how the elements are configured, the market more than likely will be nowhere close to where it has been in the past, but no matter, the way the elements are configured is directly determined by how high it has traded in the past. You really cannot see this chart very well, but the first element positioned to the lower left is Niobium, element 41, and adding 32 to that is Rhenium, E 73, and all the way to the far-right lower corner is the element Hydrogen. Uranium must be found on the upper horizontal column and Hydrogen must be found on the zero position of the squares, this is the absolute proof the elements are configured and placed properly within the square. If this is true, then all the inner dimensions will be correct just the same. How to get these squares set up properly is an art in itself, it requires imagination combined with a thorough understanding of how these squares, but more importantly, how much area is being utilized and how much time has elapsed and also how many cells or units have been completed so you can set the first element in the lower left corner of the chart.
The chart below is the fourth dimension for May 2026 for the currency pair USD JPY. This market made low right on May fifth at the price level of 155012, you can see the element, number 62, the Fibonacci number.
This website is for the students of W.D. Gann and researchers into the long mysterious "Law of Vibration" associated with this famous trader and financial trading personality of the past. There is always lots to learn and discover if you work along these lines of unique and esoteric metaphysical financial analysis. While it is quite possible that nobody will ever really know what W.D. Gann did in his own private trading, I suggest that what you see and read here is a very close if not the actual mode of operation he used under the guise "The Law of Vibration".
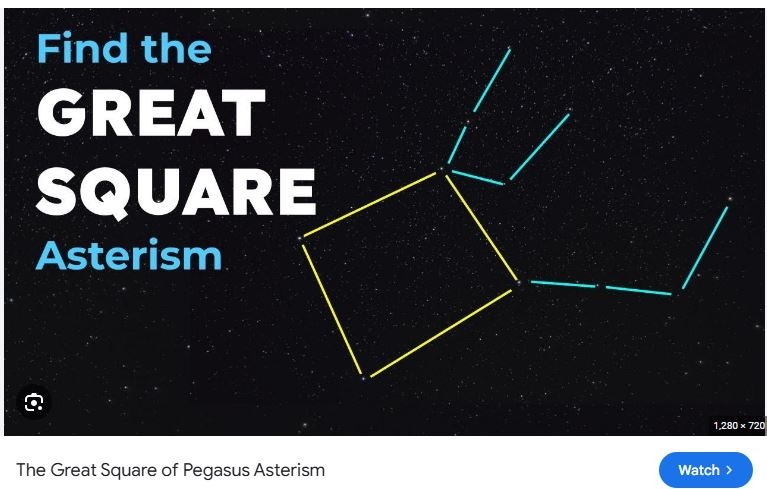
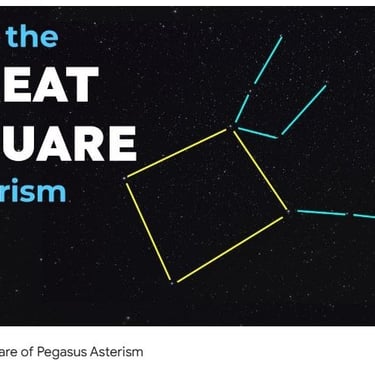
The chart below is for USD JPY for the month of June 2026 as of Friday June 12th. And you can see the price went directly to element 62, the Fibonacci element and sold off for a while. You can see where it is going off to the right where the same element is highlighted. Read page 62 of the Tunnel Through the Air where Robert tells Walter and his dad about his great discovery. And the 62nd Constellation called Pegasus, The Great Square.
Here is the Eurodollar chart for June 2026, notice the price went directly to the element 62, the Fibonacci component, then made a double bottom and you can see where it is going.
Here is the first two dimensions again for the Eurodollar, and like I mentioned before at that top to the far left you see it came in on the element Cobalt, number twenty-seven. If you follow that same horizontal line where 27 occurred, you can see the blue boxes filled in where Cobalt repeated on the same price line. You can see that in the vertical time slot for June 2026, the element is repeating again. This is precisely why W.D. Gann showed all those charts with the time counts on them, but for a totally different reason than what was originally taught. Every single thing that this great trader wrote about, talked about, showed in his charts was all veiled teaching with very different meanings than what was being shown.
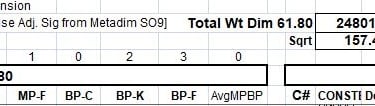
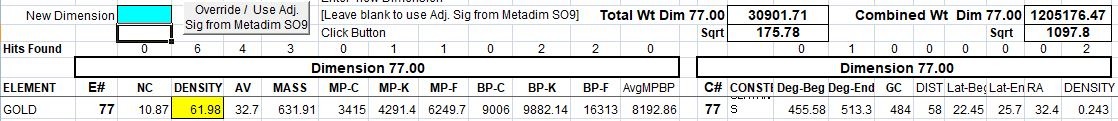
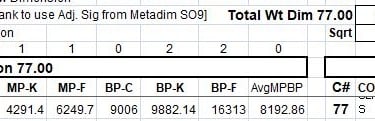
The amount of ways you can use this type of geometry is really limitless, there are so many concepts involved that can be utilized. W.D. Ganns concepts of gravity centers and return to median kind of energy can be also applied. For instance, there are actually 88 dimensions with the periodic table, each element is an actual dimension in and of itself. As this reality is is comprised of dimension 24, Chromium, there are 23 dimensions below that element and 64 dimensions above that. I will show some examples of this and how these ideas can be used from the geometry and in the markets. The mass of an element is actually the prices, the vertical structure of price is actually the weight of the elements, even the time component of the market is atomic weight. The picture below shows the combined weight of dimension 61.8, it shows the total combined mass of all 88 elements and then to the right it shows the entire combined weight of all 61.8 dimensions. It shows the total number and the square root of the same. These numbers act as powerful magnets in relation to the price especially in relation to the Fibonacci ratios and various square root harmonics.

Using the Forex currency pair of NZD-USD for the month of June 2026, the center of the square has the element Gold, number 77. Taking both of these numbers shown below for that particular dimension, you have 618039 as the center of gravity. W.D. Gann always talked about using the circle and its octaves or harmonics, and this can be done exactly the same. Because of the distance away from the price, I use 3600 points and for the amount of price travel that any Forex pair can move. Taking 155 natural squares of 3600 gives you 558000 points and subtracting that from 618038 you get the top made on the last two days of May 2026 and now the market is trading down another 3600 points at 56439. The price will do this month after month moving to the natural squares from the atomic mass of the controlling elements. Since we are almost in July, you would reconfigure the new element and where the price is going to move to. And for July 2026, the centering element is Rubidium, number 37 which has a mass number of 148489, and simply taking 25.5 squares of 3600 and subtracting that from 148489 you get 56689 and the market is holding just under that atomic mass number, just as it should be. The price, i.e. an elements atomic mass will track these centers of energy over and over again.
Another method that can be applied is to just use the same number from the mass of the dimension to find the resistance and support levels for any month. An example would be for the Eurodollar moving into July 2026. The element in control for this month is Ytterbium, and you can see the middle gravity center of both numbers below is 484398, and just using the natural squares and Fibonacci fractals you can readily see in advance where the tops and bottoms will come in. Taking 76.618 x 4843.98 and subtracting that from 484398 got the low exactly on June 24th and fifth and taking 76 x 4843.98 and subtracting that from the center you get 116256, which is where the Eurodollar should be during July 2026.


Here is the USD JPY Forex currency pair up to July 2nd, 2026. Below you can see the chemistry panel for July, second to the right vertical column, if you look to the center, you see the element Uranium at number 88 at the center of the square. The combined atomic mass of dimension 88 and 88 total dimensions divided by two is 803450. Taking 80 squares of itself, as in 80 x 8034.50 is 642760, and subtracting that from 803450 gives you the exact low USD JPY made early morning on July 2nd, 2026. Now you know why W.D. Gann said "We use the square of odd and even numbers to get, not only the proof of markets, but the cause. And knowing that the square of the number itself is even further proof of the same. This is natures computer code, or machine language if you will, a translative compiler code.


If you look at the prior charts above, you will see the EUR USD fourth dimensional chemistry chart, this market made a top on May 11th, 2026, and you can see the element for that top was element 43, Ruthenium. The price was 117872, if you subtract 4300 points of atomic mass you get 113572 and that is exactly where the market got support late June and on July 1st. And if you check the fourth dimensional chart for USD JPY above, you can see that that market made a low on May 5th at 155012. The element on that particular point on the chart is element 70, Hafnium, and if you add 7000 points of atomic mass to 155012, you get 162012. Now the price went past that level 700 more points then sold off immediately. Now the element at that top is element 28, Nickel, and subtracting 2800 from the top at 162883 is 160083 and that market made low at 106479, about 360 points short of 160083. And this is W.D. Gann's Law of Vibration and how he applied it. Read all his material, with the mindset of chemistry and the only conclusion you can come to is this is what he was teaching and doing, albeit in a very veiled and deceptive manner. In the Tunnel novel, pay attention to his talk of Gold, and the gold reserves, look for the word Noble for Noble gases, his best friend Walter, a chemist, the Radium ray, the chemical gases used by Robert Gordon during the war and also used by the enemy forces. Notice the story about silver springs, the old man's "iron" will, the love story with Bernice Mayo, and Clair Douglas and all the talk and the events at the lake. In his courses, his Stock Market course, he repeatedly talks about atomic power, and Uranium, he speaks of markets boiling and melting as a reference to the melting and boiling points of the elements. Read the ticker interview and it even becomes more obvious. And in the Tunnel novel he writes a lot of the old strange tales of spirits walking on the water, this is what Potassium does when it is in contact with water and the reason for the story being put in his novel.

Here is an recent example of the element Uranium and Hydrogen creating buying power and making a low in the market NZD USD. Late June 2026 between the the 55th and 66th eight hour bar, the price was down almost to .56000 and if you look at the square below showing the elements for that particular market and time period for the month, you can see the two elements Sulfur, number 16 which is the Fibonacci number and next to that, Uranium and Hydrogen which caused the price to reverse direction. This one trade alone if you wait on it to show up will be profitable every time. I am not showing the entire months geometry, but just the period that got the low. The elements are in the fourth dimension, where the third dimension has a gain of plus 64, the fourth dimension will be the octave of that. The first element in the the square is Tungsten, the second one is Chromium, the third one is Sulfur and then the last mini square is Uranium with Hydrogen above. This square is using 16 cells per one eighth division with one thousand points on the vertical square. This configuration works very well for the orientation and placement of the element to locate the period function accurately. The elements are found from the third dimension and are sequenced as 72 plus 128 / 88 minus 2 x 88 for element 24, 24 plus 256 / 88 minus 3 x 88 for element 16 and 16 plus 512 is precisely six square of 88 and would be Uranium with Hydrogen above that position. And that is W.D. Gann's Law of Vibration explained.


The Eurodollar made a low on July 28th, 2026 @ 1.13526, this came on the element Rhodium, which is the precise gravity center of the 88 elements and next to that you have the Noble Gas where Superman comes from.

